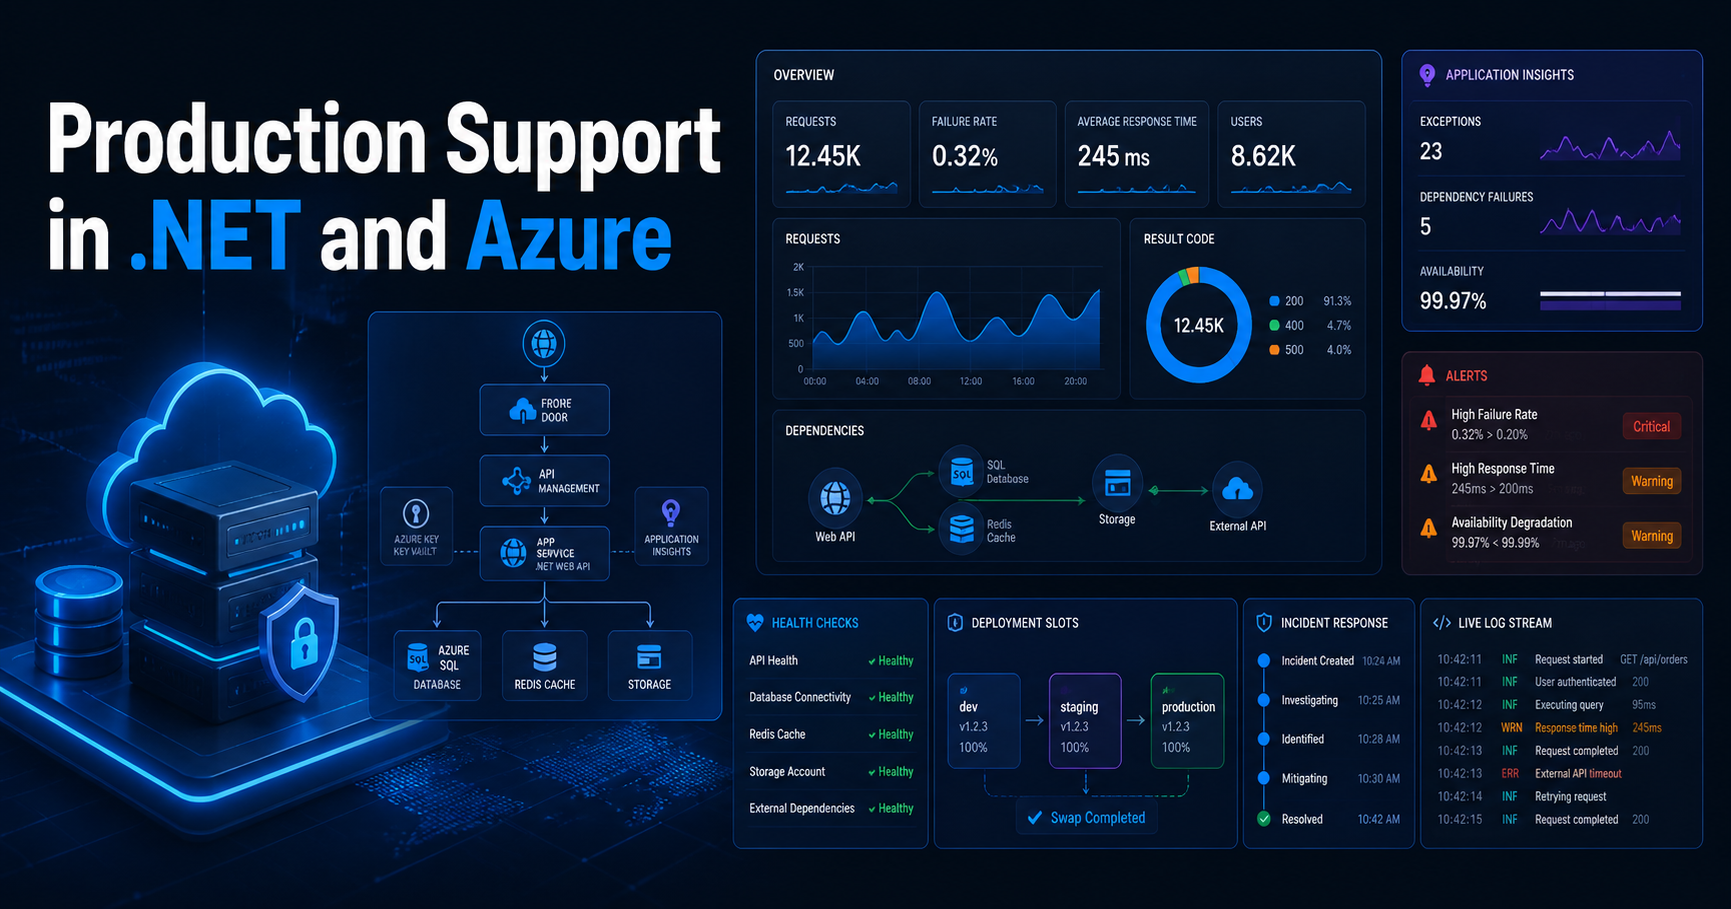
Production Support in .NET and Azure
Production support in .NET and Azure is much more than fixing bugs after release. In real systems, it means understanding live traffic, telemetry, alerts, dependencies, deployment safety, and how to stabilize a system quickly when users are already affected.
In day-to-day engineering work, Production Support in .NET and Azure is really about keeping business-critical systems stable, observable, and recoverable.
Strong Production Support in .NET and Azure also depends on clear runbooks, reliable alerts, and safe deployment practices that reduce risk during live releases.
Version Info: This post is written for modern .NET and Azure workloads, including ASP.NET Core APIs, Azure Monitor, Application Insights, health checks, deployment slots, cloud diagnostics, and incident response patterns.
Who Should Read This: This article is useful for senior .NET developers, technical leads, production support engineers, cloud architects, and Azure-focused teams who want to support live systems with better observability, safer deployments, and faster incident response.
Key Takeaways:
- Production support starts with design, not just post-release firefighting.
- Azure Monitor and Application Insights help you troubleshoot using real telemetry instead of guesswork.
- ASP.NET Core health checks are essential for live readiness and dependency monitoring.
- Deployment slots are one of the safest ways to reduce release risk in Azure App Service.
- Good support means stabilize first, investigate root cause second, and prevent recurrence third.
- Senior developers need to think about logs, alerts, runbooks, rollback, and cloud platform health together.
Table of Contents
- Why production support matters
- What production support really means
- My practical production support stack
- Common production incidents in .NET and Azure
- My incident workflow
- ASP.NET Core health check example
- Useful KQL queries during incidents
- Why deployment safety matters
- Observability advice I strongly believe in
- Official references
- FAQ
Why production support matters
I think production support is one of the clearest tests of engineering maturity. It is easy to feel good when a feature works in development. It is very different when the same feature is handling real user traffic, background jobs, retries, third-party failures, sudden spikes, or partial outages.
In a real .NET and Azure system, production support is where application design, Azure architecture, monitoring, deployment process, and operational discipline all come together.
My rule: I try to build every production system as if I might have to diagnose it quickly, under pressure, with incomplete information, while users are already impacted.
What production support really means
When I say production support, I do not mean only fixing defects after release. I mean keeping a live application stable, observable, recoverable, and safe to change.
In practice, that usually includes:
- investigating 5xx failures and degraded response times
- checking dependency failures and SQL timeouts
- watching queue backlogs and background jobs
- reviewing deployment risk and rollback options
- checking authentication, secrets, and configuration issues
- using telemetry and alerts to understand user impact
- performing root-cause analysis after restoration
This is why I consider production support a senior-level responsibility. It requires technical depth, calm decision-making, and the ability to connect application code with real platform behavior.
In real enterprise systems, Production Support in .NET and Azure is not just about fixing bugs after release. It is about observability, stability, safe deployments, and fast incident response.
Good Production Support in .NET and Azure depends on structured logging, health checks, actionable alerts, and clear rollback strategies.
My practical production support stack
In most .NET and Azure projects, I want a few building blocks in place before I trust the system in production.
1. Structured logging and correlation
If one request triggers multiple downstream calls, I want to trace that entire path. Correlation IDs, structured logs, request telemetry, dependency telemetry, and exception details should tell one connected story.
2. Azure Monitor and Application Insights
I want request trends, exceptions, failed dependencies, latency patterns, and alert history available in one operational flow. If telemetry exists but the team cannot answer simple incident questions quickly, the monitoring setup is still not good enough.
3. ASP.NET Core health checks
I like separating liveness and readiness. A service might be running but not actually ready because SQL, Redis, a queue, or an external dependency is unavailable.
4. Actionable alerts
I want alerts for meaningful operational signals, not noisy notifications that everyone starts ignoring. Good alerts should help us act early, not create alert fatigue.
5. App Service diagnostics and log access
When the app is hosted in Azure App Service, diagnostics and log access help a lot during fast-moving incidents. I want the team to be able to inspect platform behavior, startup issues, application logs, and recent failures without delay.
6. Deployment slots and safe release options
I strongly prefer safer release workflows over direct production risk. Staging slots, smoke testing, controlled swap, and rollback thinking reduce incident probability in a very practical way.
7. Azure Service Health awareness
Not every issue comes from our code. Sometimes the fastest path to the truth is checking whether Azure itself has an incident, health advisory, or resource issue.
Common production incidents in .NET and Azure
Sudden spike in 500 errors
This is one of the most common support scenarios. My first questions are simple:
- Which endpoint is failing?
- When did it start?
- Did a deployment just happen?
- Is one dependency failing underneath?
- Is it all users or a subset?
Common causes include bad deployments, missing configuration, expired secrets, database timeouts, serialization problems, authentication failures, and downstream API issues.
Performance degradation without a full outage
Sometimes the application is technically “up,” but users report that pages are slow, APIs take too long, or background processing is falling behind.
In these cases, I usually compare request duration, dependency duration, CPU, memory, queue depth, recent deployment history, and any major traffic pattern changes.
Background processing failure
Production support is not only about front-end APIs. It also includes queue processors, scheduled jobs, event-driven workflows, and document-processing pipelines.
If those components fail, customers may not see a visible 500 error immediately, but the business workflow can still be broken. That is why queue backlogs, poison message handling, and retry strategy matter so much.
Authentication or configuration drift
Many “application” incidents are actually configuration incidents: rotated secrets, wrong Key Vault access, invalid environment variables, expired certificates, or a deployment slot setting that was not applied correctly.
Practical reminder: When an incident starts, I do not assume it is always a code bug. I check recent code changes, configuration changes, secret rotation, Azure platform status, and dependency health.
My incident workflow
I try to stay disciplined during incidents because panic usually creates bad decisions.
Step 1: Confirm impact
I first confirm whether the issue is customer-facing, internal-only, intermittent, region-specific, deployment-related, or dependency-related.
Step 2: Stabilize first
I do not start by chasing the perfect root cause. I start by reducing damage.
- roll back the deployment if needed
- swap back from the staging slot
- disable or reduce a risky feature
- pause a failing background workflow
- scale out temporarily if load is part of the problem
Step 3: Use telemetry, not guesswork
I look at failed requests, exceptions, dependency calls, latency trends, logs, alert history, platform diagnostics, and cloud health signals.
Step 4: Correlate with change
I always ask what changed:
- code
- infrastructure
- configuration
- secrets
- traffic volume
- dependency behavior
Step 5: Capture root cause and prevention
Once service is restored, I want to document:
- what failed
- what triggered it
- how long users were affected
- what fixed it
- what we will change so the same issue is less likely next time
I see Production Support in .NET and Azure as a core engineering responsibility, not just an operations task.
ASP.NET Core health check example
This is a simple pattern I like for production-ready APIs. I separate liveness and readiness because they answer different operational questions.
using Microsoft.AspNetCore.Diagnostics.HealthChecks;
using Microsoft.Extensions.Diagnostics.HealthChecks;

var builder = WebApplication.CreateBuilder(args);

builder.Services.AddControllers();

builder.Services.AddHealthChecks()
    .AddCheck("self", () => HealthCheckResult.Healthy(), tags: new[] { "live" })
    .AddSqlServer(
        connectionString: builder.Configuration.GetConnectionString("DefaultConnection")!,
        name: "sql",
        tags: new[] { "ready" });

var app = builder.Build();

app.MapControllers();

app.MapHealthChecks("/health/live", new HealthCheckOptions
{
    Predicate = check => check.Tags.Contains("live")
});

app.MapHealthChecks("/health/ready", new HealthCheckOptions
{
    Predicate = check => check.Tags.Contains("ready")
});

app.Run();
This pattern helps us answer two different questions:
- Live: Is the application process running?
- Ready: Is the application actually ready to serve traffic with its important dependencies?
Simple correlation-friendly logging example
I also like adding lightweight request correlation so logs become easier to trace across multiple steps.
app.Use(async (context, next) =>
{
    var correlationId = context.Request.Headers["x-correlation-id"].FirstOrDefault()
                        ?? Guid.NewGuid().ToString("N");

    context.Response.Headers["x-correlation-id"] = correlationId;

    using (app.Logger.BeginScope(new Dictionary<string, object>
    {
        ["CorrelationId"] = correlationId,
        ["Path"] = context.Request.Path.ToString()
    }))
    {
        await next();
    }
});
This kind of small pattern makes incident analysis much easier later, especially when multiple services or downstream calls are involved.
Useful KQL queries during incidents
During production issues, I often start with a quick failure view like this:
requests
| where timestamp > ago(30m)
| where success == false or resultCode startswith "5"
| summarize failures = count(), avgDurationMs = avg(duration)
    by operation_Name, cloud_RoleName, bin(timestamp, 5m)
| order by timestamp desc
Then I usually compare it with dependency failures:
dependencies
| where timestamp > ago(30m)
| summarize failed = countif(success == false), avgDurationMs = avg(duration)
    by target, type
| order by failed desc
These kinds of quick queries help answer the first few questions fast: what is failing, where it is failing, whether the problem is growing, and whether a dependency is the actual root issue.
Why deployment safety matters
I consider deployment slots one of the most underrated support tools in Azure App Service.
They help teams:
- validate a release in a staging environment
- run smoke tests before production exposure
- swap traffic more safely
- roll back faster when things go wrong
- reduce fear around release day
A lot of production incidents are not purely “application bugs.” They are deployment mistakes, configuration mismatches, or release-process problems. Safer deployment patterns reduce those risks directly.
| Area | What I want in place |
|---|---|
| Logging | Structured logs with correlation IDs and meaningful error context |
| Monitoring | Azure Monitor dashboards, Application Insights telemetry, baseline trends |
| Health | Liveness and readiness endpoints with dependency-aware checks |
| Alerts | Actionable alerts for failures, latency, dependency issues, and unusual spikes |
| Deployment | Staging slot, smoke test path, rollback path, release checklist |
| Operations | Runbook, incident owner, escalation path, root-cause review |
Observability advice I strongly believe in
Do not wait for production to invent your monitoring story
Good support does not begin with the first incident. It begins while designing endpoints, dependencies, logging, retry behavior, and failure paths.
Logs alone are not enough
I want logs, metrics, traces, dependency telemetry, and health signals together. One signal without context often creates more confusion than clarity.
Alert tuning matters
Too many alerts create fatigue. Too few create blind spots. The goal is not maximum alert count. The goal is useful operational awareness.
Always check the platform too
It is easy to blame the application immediately. But platform diagnostics, Azure Service Health, and resource health checks can save a lot of wasted debugging time.
Runbooks are part of quality
If production support depends on one person remembering everything from memory, the system is not really supportable. Important incident actions should be documented, repeatable, and easy to follow.
Why is Production Support in .NET and Azure important?
Production Support in .NET and Azure is important because live systems need monitoring, incident handling, deployment safety, and root-cause analysis long after code is released.
Final thoughts
Production support in .NET and Azure is where software engineering becomes very real. This is where architecture, coding quality, cloud design, observability, and team discipline all meet.
A stable production system is not created by luck. It is created by good design, clear telemetry, controlled deployment, and calm incident handling.
“Build every .NET system as if you will have to diagnose it in production with limited time, partial information, and real users waiting.”
Official References
For official guidance, I recommend reviewing Azure Monitor documentation, ASP.NET Core health checks documentation, and Azure App Service deployment slots documentation.
FAQ
What tools are most important for production support in .NET and Azure?
For most teams, I would start with Azure Monitor, Application Insights, ASP.NET Core health checks, Azure Monitor alerts, App Service diagnostics, deployment slots, and Azure Service Health.
Why are health checks so important in production APIs?
Health checks help us separate “the app process is running” from “the app is actually ready to serve traffic.” That distinction matters a lot during incidents and during deployment validation.
Why do deployment slots matter so much for support?
Because they reduce release risk. They let us validate a build, test safely, promote more confidently, and roll back faster when something goes wrong.
What is the biggest mistake teams make in production support?
In my experience, one of the biggest mistakes is treating production support as an afterthought. Systems become much easier to support when observability, alerts, health checks, and rollback thinking are built in from the beginning.
How do senior developers add value during incidents?
Senior developers connect application behavior, telemetry, platform signals, release history, and dependency health. They help stabilize quickly, identify likely causes, and prevent repeated failures.
Want more practical Azure and .NET articles like this?
You can also read Azure Functions Interview Questions with Real Project Examples and How to Build AI Apps in .NET Using Microsoft.Extensions.AI.
Recommended AI Tools & Resources
If you found this article useful, here are some AI tools and resources from AINexArch that can help you work faster and smarter:
- Best AI Writing Tools 2026 — top tools for writing, content, and productivity
- ChatGPT vs Claude 2026 — which AI is better for developers?
- Best Free AI Tools 2026 — powerful AI tools that cost nothing
- Best AI Tools for Content Creators 2026 — complete guide
If you create technical videos, tutorials, or podcast content alongside your development work, ElevenLabs is the best AI voice generator available in 2026. Turn your written content into professional audio in seconds.
👉 Try ElevenLabs Free — Best AI Voice Generator 2026
Disclosure: This article contains affiliate links. If you sign up through my link, I may earn a commission at no extra cost to you.